Measuring, Reporting, and Modeling the key iNetwork Management Metrics that matter most to senior executives and organizations!
“If you don’t measure it, you can’t manage it 📏📊”
“If you don’t measure it, you can’t improve it 📈🔧”
“If you don’t measure it, you probably don’t care 🤷♂️💭”
“If you can’t influence it, then don’t measure it 🚫📏”

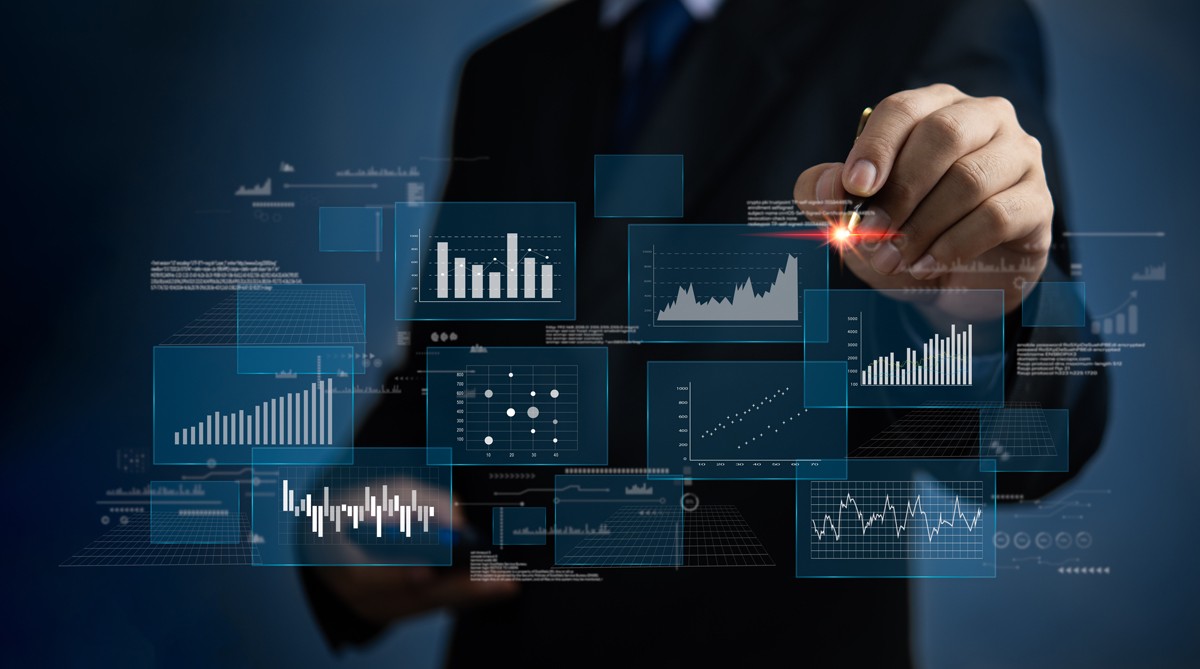
Are you ready to take your iNetwork experience to the next level? We’re excited to introduce the latest enhancement to the iEvent platform – Business Intelligence (BI) Graphs. Now available across various platforms, including web, Android, iOS, and desktop installations for Windows, Mac, and Linux, our BI Graphs are designed to empower you with a deeper understanding of user interactions and event sentiment analysis.
Here’s what you can expect from the new BI Graphs in iNetwork :
1. Visualize Event Sentiment Analysis: With our BI Graphs, you can now delve into the sentiment analysis of posts and comments. We’ve transformed data into visual insights, making it easier for you to understand the sentiment trends over time.

2. Complete User Interaction Overview: Our graphs provide a comprehensive view of how users interact with various elements on the platform. You’ll see charts highlighting user engagement with posts, pictures, videos, polls, and more. It’s like having a magnifying glass on user behaviour.

3. Detailed Analysis for Logged-In Users: For registered users, our BI Graphs offer a wealth of statistics and analytics. Dive deep into your statistics and track your engagement and activity on the platform. Whether you’re a participant or an event organizer, these insights are invaluable for improving your experience.

With the integration of Business Intelligence Graphs into the iEvent application, we aim to make your journey more data-driven and insightful. Whether you’re a seasoned iNetwork user or just starting your journey, these BI Graphs will open up a new world of possibilities.

Experience the power of data visualization and analytics like never before. Upgrade your iNetwork app today and start exploring the future of user interaction and event sentiment analysis.
Don’t miss out on this exciting update. Get ready to transform your iEvent experience with BI Graphs.